Mastering Market Trends: Seizing the Global Trade Shift for Maximum Profits
Hello, outstanding students of Diamond Ridge Financial Academy!
I'm Charles Hanover, and it's a great honour to be here with you as we embark on this journey to explore the secrets of quantitative trading.
In the ever-changing financial markets, acquiring knowledge is just the first step. The real key is knowing how to use that knowledge to navigate market swings and achieve steady, long-term investment returns. Tonight, we'll start by analyzing the current stock market trends and breaking down the opportunities created by recent tariff policies to help you reach the 'Double Your Capital' profit goal.
Today, the UK stock market showed an overall upward trend with some volatility. The FTSE 100 rose 0.4%, driven by geopolitical events, expectations for defence spending in the US and Europe, and corporate earnings reports. The defence sector was the biggest highlight, with BAE Systems surging 9%, leading UK blue-chip stocks. European leaders held emergency talks on the Ukraine situation, while the US pushed for separate peace negotiations. This led to widespread market expectations that European countries would further increase defence spending. Additionally, NATO's Secretary-General proposed raising the defence budget to over 3% of GDP, and Trump had previously urged European allies to boost military spending. These factors fueled a rally in European defence stocks. The increase in defence budgets not only boosted earnings expectations for related companies but also drove more capital into the sector, reinforcing this trend.
Meanwhile, the financial sector rebounded after a market adjustment. NatWest and Barclays recovered after briefly pulling back after last week’s earnings reports, showing that long-term profit expectations for the banking industry remain optimistic. This suggests that despite short-term fluctuations, the market still has confidence in the stability and profitability of financial institutions. In addition, the British pound climbed to a two-month high as investors watched upcoming inflation and unemployment data. These numbers will not only shape the UK’s short-term economic outlook but also impact liquidity and expectations for monetary policy changes. In this context, market capital flows have started to show some divergence. Interest rate expectations are influencing the real estate sector’s performance, while stocks of companies related to the Ukrainian market have surged. This suggests that despite previous concerns, the market still holds some hope for an economic recovery driven by easing tensions.
Against this backdrop, high global inflation and new tariff policies have already caused notable market swings. Safe-haven assets like gold have seen a strong trend rally. As global trade tensions escalate, negotiations on tariffs will take centre stage this week, adding new uncertainties to global capital flows. Looking at past market behaviour, money tends to move into safe-haven assets, including gold and crypto, whenever trade conflicts intensify. This suggests that the market's focus isn't just on gold's surge; crypto markets could also see a similar trend rally, making them a key trading opportunity for us in the near term.
Market trends don’t happen by chance; they are the inevitable result of both fundamental and technical factors working together. Economic cycles, policy environments, capital flows and industry growth stages all play a role in determining market direction. In the short term, markets may experience sharp swings due to breaking news or economic data. However, from a trend perspective, the market usually follows a clear path, which is shaped by multiple factors, including economic cycles, policy shifts, capital movements, and industry developments. To help everyone better understand trends, I will now explain how trends form and where the opportunities lie from both a fundamental and technical perspective.
The core of fundamental analysis is industry cycles, policy impact and the macroeconomic environment. Industry cycles are often the key driving force behind trend movements. For example, over the past two decades, the tech sector has evolved from the Internet age to the AI era, creating massive market opportunities. Nvidia is a prime example of a company that has benefited from this industry trend. With the rise of AI, big data and cloud computing, the global demand for high-performance chips has soared, and Nvidia’s stock price has skyrocketed 50x over the past five years. This surge was fundamentally driven by the long-term growth logic of the industry, which led to a sustained trend. As we can see, in the development of the AI industry, chips serve as a core infrastructure, making them a top target for market capital. With its leading GPU technology, Nvidia aligned perfectly with this industry trend, allowing it to achieve long-term, steady growth.
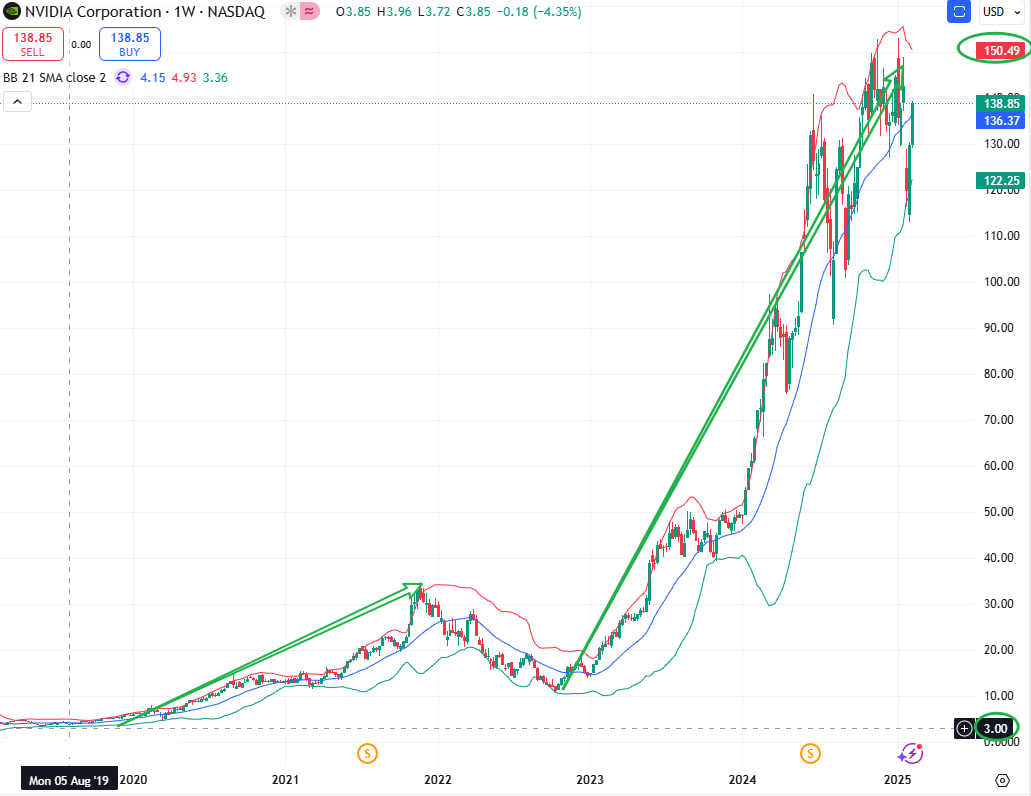 This trend is not just based on fundamental logic; it also shows up in technical patterns. As seen in the chart above, looking at Nvidia’s historical price movement, we can see that after a long period of consolidation, the upper and lower bands of the BOLL indicator started to widen, forming a clear trend. This kind of technical shift is often accompanied by capital inflows, signalling that the market is gaining confidence in the industry’s future growth. In fact, the start of a trend usually appears in technical indicators first, and when fundamentals provide enough support, the trend tends to continue.
On the other hand, policy cycles are also key factors that shape market trends. Policy cycles mainly include economic and monetary policies, with monetary policy having the most significant impact. Looking at historical data, in the mid-2000s, the US gradually loosened monetary policy to counter an economic slowdown. By early 2001, the Federal Reserve officially began a series of rate cuts, pushing the market into an easing cycle. Similarly, in 2007, facing the impact of the financial crisis, the Fed once again launched large-scale rate cuts to ease market pressure. These rate cuts may provide short-term stimulus, but looking at historical trends, the Fed’s rate-cutting cycles have not been able to stop the broader market downturn.
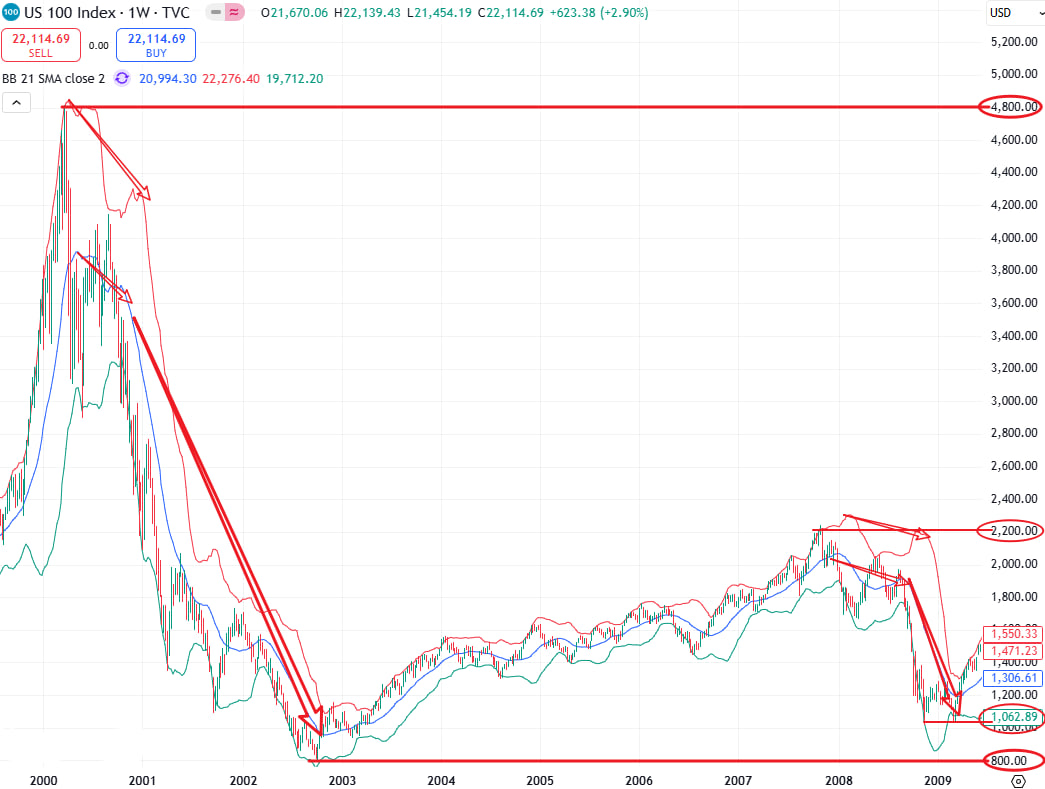
If we look at the market trends at the time, every time the Fed entered a rate-cutting cycle, the stock market experienced a major decline. For example, during the rate-cut cycle that started in 2000, the Nasdaq Index fell from 4,800 points to 800 points by the end of 2002, a drop of over 80%. Similarly, after the Fed began cutting rates in 2007, the Nasdaq dropped from 2,200 points to 1,050 points, losing more than 50% of its value. From a technical perspective, whenever the market enters a rate-cutting cycle, the upper and middle bands of the BOLL indicator tend to turn downward, which is one of the signals that the market trend is about to reverse.
Many people may wonder, rate cuts are usually seen as positive for the economy, so why does the stock market drop during rate-cut cycles? The key here is that rate cuts don’t directly drive economic growth. Instead, they are more of a policy response. When the government starts intervening on a large scale, it usually means the economy is already in serious trouble. Take the rate-cut cycles in 2001 and 2007 as examples; there was typically a rate-hike cycle before the Fed started cutting rates. This means that before the cuts, the market was already dealing with high inflation and asset bubbles. The purpose of cutting rates was to ease the impact of these problems. However, even rate cuts can’t stop the market’s downward trend when the economy faces systemic risks. In other words, rate cuts are just a buffer; they are not the real driver of economic recovery.
If we apply this logic to the current market environment, we can better understand where the market is heading. In Sep 2024, the Fed officially started this round of rate cuts, which the market has called the “strongest rate-cut cycle in history.” This policy move is actually a correction for the global economic imbalances of recent years. Even before the pandemic, the global economy was already in a stagflation phase, with inflation surging. Then, in early 2020, the pandemic accelerated the process. Central banks worldwide adopted large-scale monetary easing policies to combat economic stagnation, especially the Fed, which injected more liquidity in two years than the total dollar supply increase over the past 50 years. This extreme monetary policy led to a rapid surge in asset prices but also created hidden risks for the future economy.
Later, as inflation got out of control, the Fed launched the most aggressive rate-hike cycle in history in 2022, trying to curb inflation by tightening liquidity. However, the economy quickly weakened after a brief period of strong stimulus. By the end of 2023, US inflation had slightly cooled, and to prevent a hard landing, the Fed immediately started a new round of rate cuts. Based on historical patterns, this kind of shift from extreme rate hikes to extreme rate cuts often signals that the market is about to enter a recession cycle.
The US stock market’s performance is still holding relatively strong, but the Fourth Industrial Revolution industry boom mainly drives this strength. Without the push from emerging industries like AI and the digital economy, the US stock market would likely have already entered a downtrend.
In other words, the current US stock market rally is not because of a strong economic foundation but because of high expectations for new technologies. However, this logic won’t last forever, especially with Trump’s new round of trade protection policies putting more pressure on the tech sector. If market confidence in tech stocks takes a hit, the overall trend of US stocks could reverse quickly.
Based on historical data, the market eventually enters a major downturn every time the Fed starts a rate-cut cycle. Looking at the declines from the last two rate-cut cycles, we can predict that the US stock market could correct by more than 30% this time. The current stagnation in US stocks also suggests that the market is already in a consolidation phase, which explains why safe-haven assets like gold have been surging recently. For investors, the best strategy now is to “sell on rallies, take small profits on smaller upticks,” gradually reducing positions to avoid getting caught off guard when the market trend reverses.
The essence of investing is to follow the trend, identify the major directions of tech and global economic development, and then invest accordingly to profit easily. Before 2024, no matter what price you bought Nvidia, BTC or other tech-related assets at, you would have made big profits in the end. The long-term trend of the tech industry is clear, and the capital market is pricing this trend in advance. Similarly, following the trend and selling stocks in late 2000 or 2007 would have helped avoid the losses from major market crashes. Market trends exist objectively; as long as you can identify them accurately and apply the right investment strategies, you can better manage risk while maximizing returns.
Current economic policies are also forming a new trend, creating great profit opportunities for the market. The global capital market is now at a stage where monetary policy and economic policy are deeply intertwined. Especially with Trump back in office, the US government is aggressively pushing a strategy of "saving the domestic economy by imposing tariffs," leading to major shifts in global trade patterns. Right now, tariff policies are expanding from localized impacts to a global scale, and this week will be the peak of discussions around tariff policies.
Countries like Mexico, Canada, India, and Brazil are expected to actively negotiate tariffs with the US. This means that from this week until early Apr, global tariff policies will be rolled out one after another. This period presents an excellent trading opportunity driven by tariff policies. In particular, the global tariff discussions happening this week could trigger a major market trend. We expect this week's market movements to drive BTC into a $15K price swing, which is the core strategy of our "Capital Doubling" profit plan.
Even though the US market is closed today due to a holiday, market sentiment remains highly active. Eth has already shown a clear trend move this morning in UK time. After rebounding from $2.65K, it quickly entered an uptrend, reaching a high of $2.85K, creating a $200 price swing. Even capturing just half of this range could easily generate over 300% returns. If you used 20% of your capital to trade this move, your profits would be over 60%. This is the power of trend trading; when the market reaches key policy moments, it naturally picks a direction, and traders simply need to follow the trend to achieve their ideal profit goals.
Meanwhile, students who received the arbitrage trading strategy this morning should have already seen at least a 20% capital increase today if they followed the plan strictly. This once again proves the reliability of our strategy. As long as you stick to the plan, the market will provide enough profit opportunities. So, make sure to stay closely aligned with the upcoming trading plan. This high-certainty trend driven by global tariff policies will bring extremely profitable opportunities. For those still in the early stages of capital growth, accurately capturing market trends will be the key to quickly doubling your funds.
More importantly, the compounding effect of these short-term trades cannot be ignored. Let's take a $100K starting capital as an example. If you followed our strategy since the public test ended, here's how your account would look by tonight:
The first profit plan achieved over 50% returns, bringing total capital to $150K.
The second profit plan reached 80% returns, growing total funds to $270K.
Today's 20% profit further increased total funds to $324K.
This is the power of compound growth. Profits are amplified after every trade, leading to far greater returns than expected. So, in the upcoming "Capital Doubling" profit plan, we will fully focus on the market opportunities created by global tariff policies to ensure we maximize gains from this trend.
First, Tuesday marks the beginning of the trend move, and we will use BTC and AI-related tokens for arbitrage trading. This strategy not only helps hedge against early market uncertainty but also captures profits as the trend starts to develop. With the UK's unemployment data set to be released, we expect daily trading profits to be around 20%.
Next, details of the EU-US tariff policy will be announced on Wednesday, along with the UK CPI data and the Fed's Jan FOMC meeting minutes. The release of these key data points will drive strong market volatility, with expected daily profits reaching 30%.
By Thursday, governments worldwide will start releasing statements on reciprocal tariff policies, and the trend of BTC's move is expected to take full shape. Additionally, the release of the US Philadelphia Manufacturing Index may create extra short-term trading opportunities, with overall profit potential exceeding 30%.
Finally, on Friday, the market will react to the US Feb S&P Global Manufacturing PMI preliminary reading and the final Michigan Consumer Sentiment Index. This will bring the last major data-driven market move of the week, with expected profits of around 20%. Overall, this week's profit targets should be met smoothly, and we may even exceed them. Please contact the assistant team if you miss some trades due to time or capital constraints. We will ensure that every dedicated student receives the necessary trading support.
The key to investing is following the trend. By leveraging technology, policy and market trends, making profits becomes much easier. The tariff-driven market trend has already begun, and all students should act now to seize this clear trading opportunity. High-quality trading setups don't come often, especially for investors still in the early stages of capital growth. It's crucial to take advantage of every chance to rapidly scale up funds.
Meanwhile, students who have already built up some capital but lack the time for high-frequency trading can follow the "Three-Part Investment Portfolio" strategy for medium to long-term positions. One standout opportunity is the trend-driven token AQS, which is expected to see a strong rally before the official launch of its quantitative trading system. The current price is only around $1.40, but it may rise above $4 by the end of next month. Buying at a low price while the market is still in its early stages is a great opportunity.
In short, wealth grows and multiplies by following the trend. Through tonight's discussion, I hope everyone truly understands the importance of trends. Whether it's riding the 50x surge of Nvidia by following the tech industry's growth or recognizing the market downturn caused by the Fed's rate-cut cycle and adjusting positions early to avoid a 50% drop in US stocks, only by moving with the trend can you navigate market volatility with confidence and achieve continuous asset growth.
Now that the global tariff policy trend is in motion, real investors should use the most advanced quantitative trading tools to follow this trend and achieve the "Capital Doubling" profit goal.
All students, prepare your funds. The market opportunity has arrived, and it's a promising one. Your capital size directly influences your earning potential; the larger your capital, the more opportunities you can seize and the higher your final profits will be. This is an exciting time to act. Let's capture this market trend with precision and aim for a significant leap in wealth during this global trade shift!